"Near me" doesn't mean your street. It means wherever the shopper is standing.
A shopper searching "bike shop near me" or "garden centre near me" gets a completely different set of results depending on which street they're standing on — and a store that's easy to find right outside its own door can be invisible five minutes away, exactly where the next customer is searching from. SeoMap grids the area around a store and colours every point by where it actually shows up, so you see precisely how far your foot-traffic reach extends before a chain store or a competitor takes over.
Built around what you actually do all day.
- 01
Matching the grid to how far customers actually travel
A convenience purchase and a specialty one don't have the same catchment area — a bakery's radius is a few blocks, a furniture or bike shop's can be a whole district. Grid size and spacing (5×5 up to 15×15) are fully configurable, so the scan matches the real behaviour for the category, not a generic default.
- 02
One scan per product category, not one storefront check
"bike shop", "e-bike repair" and "bike shop near me" can each surface a different set of stores at the same address. Run a separate scan per category or service you actually want walk-ins for, instead of one generic "we're on Maps" check.
- 03
Seeing exactly which chain or competitor owns the pack instead
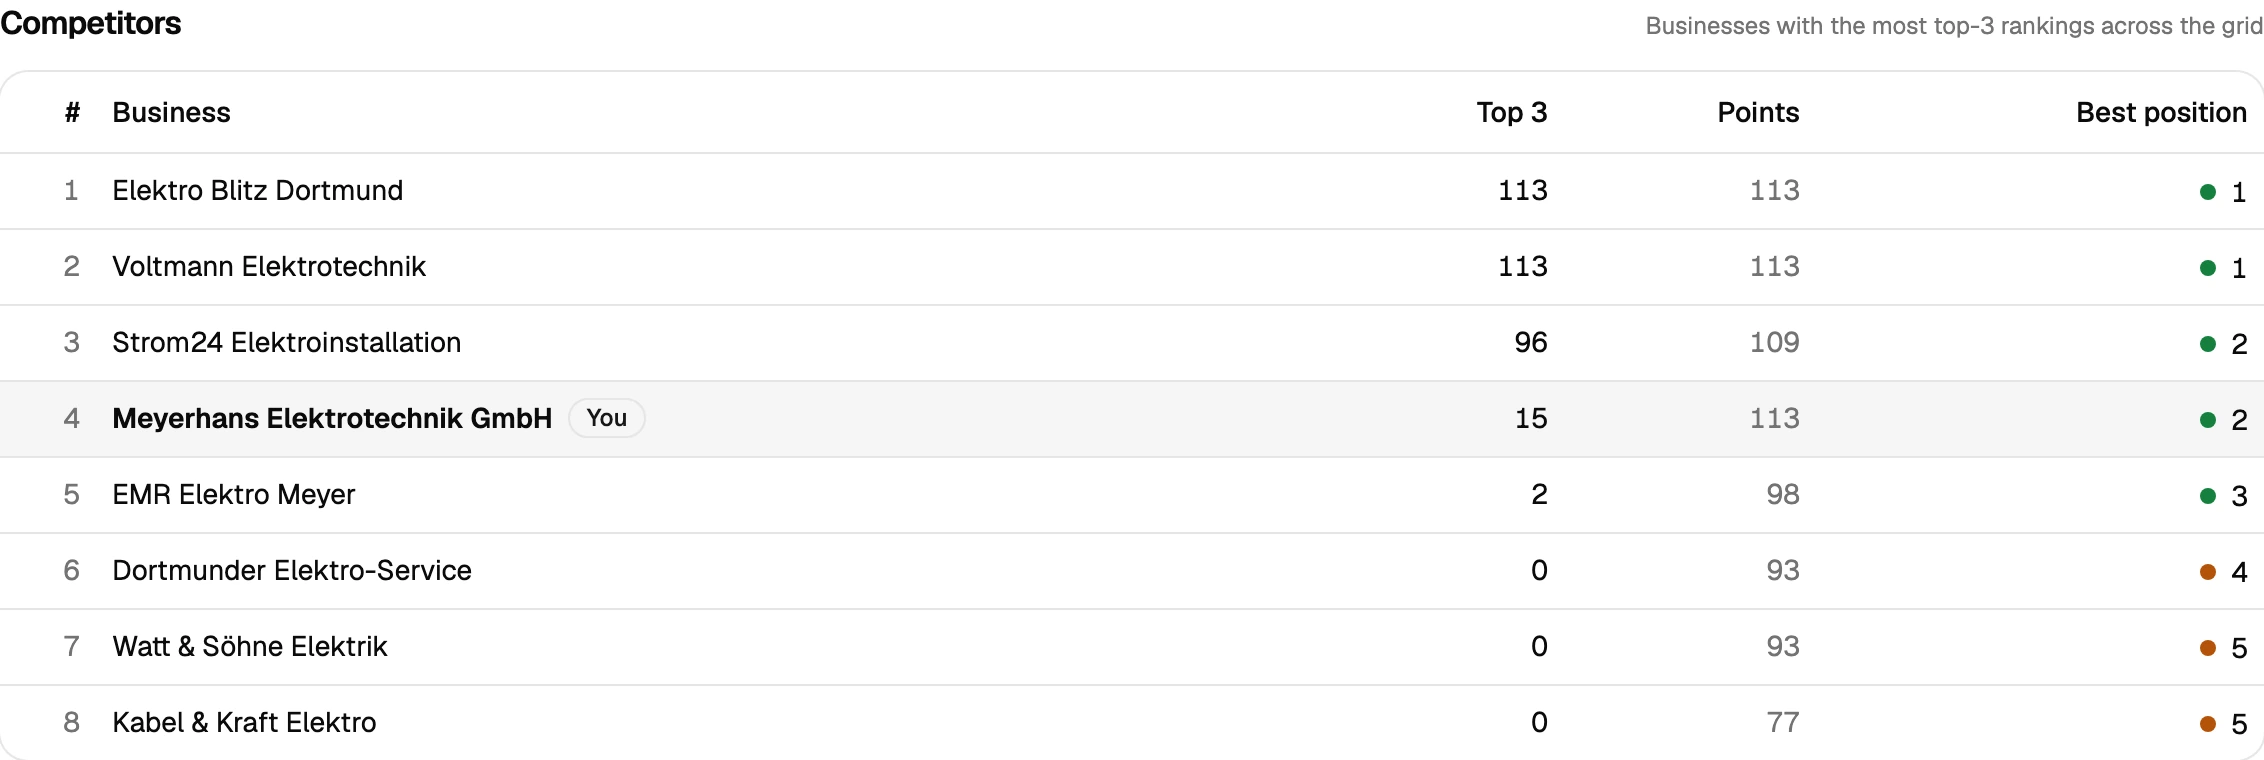
Competitor analysis ranks every business that shows up across the grid by how often it lands in the top 3 — including big-box or franchise competitors. That's the answer to which chain is actually eating your foot traffic in a given district, not a guess.
- 04
Multi-location retail without the branches getting mixed up
Each project is matched by Google CID/Place-ID, not by name — so a retailer running several branches across a city doesn't get them confused with each other, or with an unrelated store sharing the same name. Run each location's grid separately and compare foot-traffic reach side by side.
- 05
Proving a Google Business Profile refresh or a local promo worked
After updating product categories, adding new photos or running a local promotion, scan comparison lays the old and new grid side by side and shows the delta per point — improved, dropped, new, lost. That's what goes into the next marketing budget conversation, not just a claim that foot traffic "felt better".
What a retail store’s foot-traffic radius actually looks like on a map
Retail search is shaped by how far people are willing to travel for a given category, and that radius varies enormously — a few blocks for a bakery or a convenience store, a whole district or more for a specialty retailer people plan a trip around. A single “are we on Google Maps” check can’t tell you which situation your store is in, because it only confirms visibility at one point, usually right outside the front door where visibility is rarely the problem.
A grid scan makes the real boundary visible. Set the grid size and spacing to match the category — tight for convenience purchases, wider for destination retail — and run it on the search terms shoppers actually type for what the store sells. The map fills in point by point: green near the store, and, at some distance that depends entirely on the category and the competition, red where a chain store, a franchise location, or another independent retailer starts taking the top spots instead. Competitor analysis then ranks exactly who those competitors are across the whole grid, not just at one address — useful when the real competitor for a given district turns out to be a big-box chain rather than the store down the street.
For a retailer running several locations, running that same grid separately per store — matched by CID/Place-ID so two branches or two unrelated stores sharing a name never get confused — turns into a comparison of which location has the widest real foot-traffic reach, and which one needs a local push before the next marketing budget gets allocated.
Prepare your measurement
Questions we actually get asked.
We rank well right outside our shop — why don't people from the next neighbourhood find us?
Google Maps rankings are calculated per coordinate, based on proximity, relevance and the profile's own signals — a strong position outside your own door says nothing about a district a few streets over. A grid scan is the only way to see that boundary instead of assuming it from a single check.
How do I know which grid size fits my type of store?
It follows how far customers already travel for that category. A convenience or grocery store usually needs a tight 5×5 to 7×7 grid; a specialty retailer people drive across town for (furniture, bikes, electronics) often needs a wider 9×9 to 13×13 grid.
Can I see which chain stores are beating us in the pack?
Yes — competitor analysis ranks every business showing up in the grid by how often it lands in the top 3, which surfaces chain and franchise competitors just as clearly as independent ones.
We run several store locations — will they get mixed up?
No. Every project is matched by Google CID/Place-ID rather than name, so branches of the same retailer — or two unrelated stores sharing a name — stay cleanly separate.
Is there a way to try this before committing a promotion budget?
Yes — 500 free credits on signup, no credit card. Enough to run a real scan around the store before deciding where the next local promotion or ad budget should go.
Can I pull the data into another tool, or do I need to read every scan myself?
Both are covered. A read-only REST API ships with every plan — self-managed, revocable keys, endpoints for projects, scans and individual grid points — so you can wire results into Zapier, n8n or your own reporting. Every completed scan also gets a short AI-generated analysis paragraph automatically, on top of the existing rule-based breakdown, so you're not staring at a raw grid trying to figure out what changed.
Lay the map over your service area.
The first scan takes under three minutes. After that you’ll see your visibility the way your customers do.