New patients don't drive across town for a dentist.
Most patients pick a dentist from the map pack near where they live or work — not the one with the best website. A practice can rank #1 two streets from its own door and be invisible three streets further out, and a single "we're on page one" report never shows that. SeoMap puts a GPS grid over the practice's real catchment area and colours every point by where it actually ranks, so you can see the exact street where a competitor starts winning.
Built around what you actually do all day.
- 01
Finding the street where visibility drops
A 7×7 or 9×9 grid centred on the practice shows green near the door and, in most dense city districts, red within a couple of kilometres — a different practice takes over. That's the map a practice owner needs before deciding whether to run ads for a neighbouring district or just accept the boundary.
- 02
One keyword isn't one ranking
"Zahnarzt" and "Kinderzahnarzt" or "Notdienst Zahnarzt" can return completely different map packs at the same coordinate. Run a separate scan per treatment keyword, or import the practice's Google Search Console data to pre-fill the actual queries patients used in the last 90 days instead of guessing.
- 03
Dental groups with more than one location
Each project is matched to a business by its Google CID/Place-ID, not by name — so a three-location practice group doesn't get its branches confused with each other, or with an unrelated practice that happens to share a name. Run each location's grid separately and compare them side by side.
- 04
Convincing a practice owner who has ten minutes between patients
Dentists don't read ranking spreadsheets. A red-and-green heatmap next to the practice's own address explains the problem in one glance — share it as a public link, no login needed, or drop it straight into a report.
- 05
Proving a campaign actually moved the needle
After a Google Business Profile clean-up or a new landing page, scan comparison lays the old and new grid side by side and shows the delta per point — improved, dropped, new, lost. That's what goes into the next quarterly review with the practice.
What a dental practice’s grid actually looks like
Dental search is some of the most hyperlocal search there is. Patients rarely cross a city for a routine appointment — they pick from whoever shows up in the map pack near their home, their office, or their kid’s school. That means the radius that matters for a dental practice is often just a handful of city blocks, not the whole metro area, and a practice that looks strong on a single “are we ranking” check can be sitting on a boundary it doesn’t know exists.
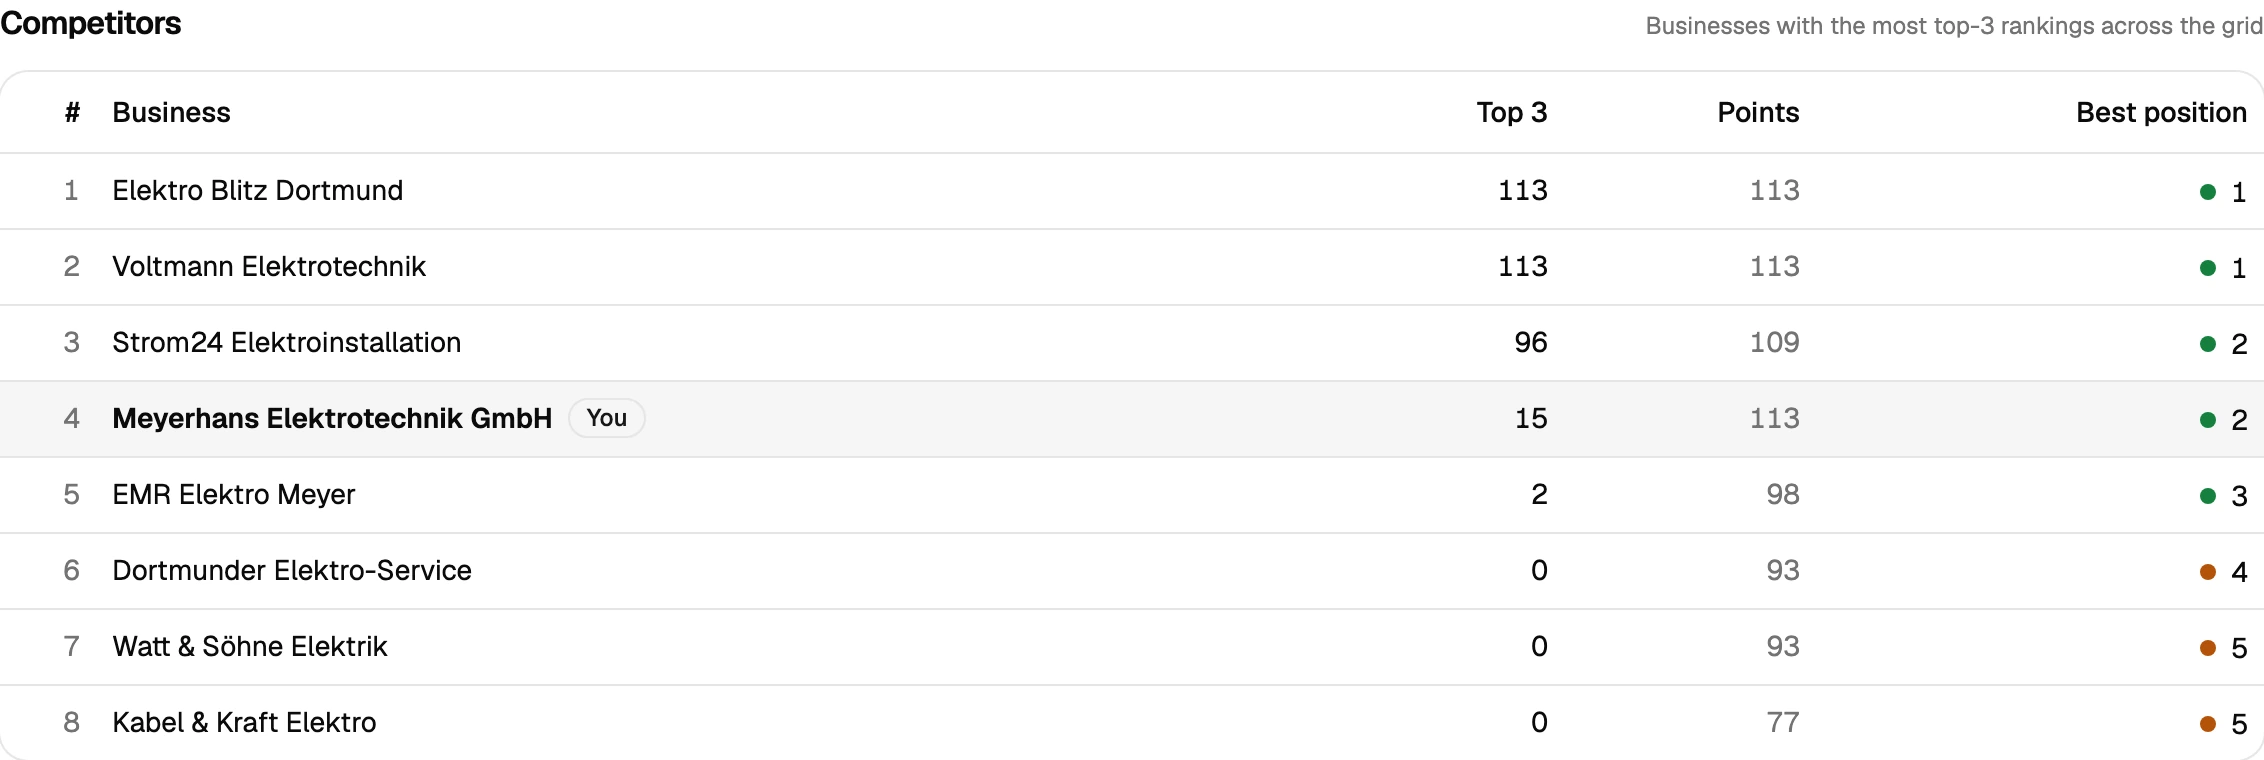
A grid scan makes that boundary visible. Centre a 7×7 or 9×9 grid on the practice’s address, run it on the treatment keyword that matters most, and the map fills in point by point: green near the practice, and — in most dense districts — red starting a couple of kilometres out, where a different practice takes the top spots instead. ATRP (Average Total Rank Position) counts every point where the practice didn’t show up at all, not just where it did, which matters here specifically because “we’re not in the top 20” is common at the edge of a dental catchment area and easy to hide if a metric quietly drops those points.
For a group running several locations, that same grid run separately per practice — matched by CID/Place-ID so two branches (or two unrelated practices sharing a name) never get confused — turns into a comparison of which location has the widest real reach, and which one needs work before the next marketing budget gets allocated.
Prepare your measurement
Questions we actually get asked.
Why does the practice rank #1 in normal search but not on Google Maps two streets over?
Google Maps rankings are calculated per coordinate, based on proximity, relevance and the profile's own signals — they're not one global position. A grid scan is the only way to see that boundary instead of guessing at it from a single check.
Can I track different treatments as separate keywords?
Yes — run one scan per keyword ("Zahnarzt", "Kieferorthopäde", "Zahnreinigung", "Notdienst Zahnarzt"...). Each keyword can return a different map pack at the exact same location, so treating them as one ranking hides real differences.
We run a dental group with several locations — will they get mixed up?
No. Every project is linked by Google CID/Place-ID, not by name, so two practices in the same group — or a practice sharing a name with an unrelated one across town — stay separate.
What grid size makes sense for a dental practice?
Dental search tends to be tight — most practices see the real boundary within a 5×5 to 9×9 grid at a small point spacing. A 7×7 scan (49 credits on queue, 147 on live) is usually enough for a first look; widen it only if you're not seeing red yet.
Is there a way to try this before committing a client's or the practice's budget?
Yes — 500 free credits on signup, no credit card. Enough to run a couple of real scans on the practice before deciding on a plan.
Can I pull the data into another tool, or do I need to read every scan myself?
Both are covered. A read-only REST API ships with every plan — self-managed, revocable keys, endpoints for projects, scans and individual grid points — so you can wire results into Zapier, n8n or your own reporting. Every completed scan also gets a short AI-generated analysis paragraph automatically, on top of the existing rule-based breakdown, so you're not staring at a raw grid trying to figure out what changed.
Lay the map over your service area.
The first scan takes under three minutes. After that you’ll see your visibility the way your customers do.