The owner deciding who manages their rental isn't searching from your office. They're searching from the property.
"Property management company near me" gets typed from the address of the rental an owner wants managed, not from your office — so a ranking check run once at headquarters says nothing about whether you show up in the submarket where that property actually sits. SeoMap simulates that search across every neighbourhood where the properties you want to manage actually are, and matches listings by Google CID/Place-ID, not by name, so multi-branch firms and franchise-style networks stay cleanly separated instead of blurring into one another.
Built around what you actually do all day.
- 01
A grid centred on the properties, not on headquarters
The searcher is an owner standing at (or thinking about) their rental property, not someone walking past your office — so centre the scan on the submarkets where those properties sit. A configurable 7×7 to 13×13 grid covers one dense rental corridor tightly or several submarkets more loosely, matching how spread out your service area actually is.
- 02
Owner-facing terms scanned separately from tenant-facing ones
"Property management company near me" and "rental property manager in [neighbourhood]" are the searches that bring in your actual customer — the owner. Scanning those separately from tenant-facing terms like "apartments for rent" keeps the acquisition-relevant signal from getting diluted by irrelevant traffic.
- 03
Multiple branch offices, kept apart even under a shared franchise name
Every project is matched by Google CID/Place-ID rather than name, so a firm running several branch offices across a metro — or competing against a national franchise network with dozens of near-identical local listings — always knows which listing is actually being seen where.
- 04
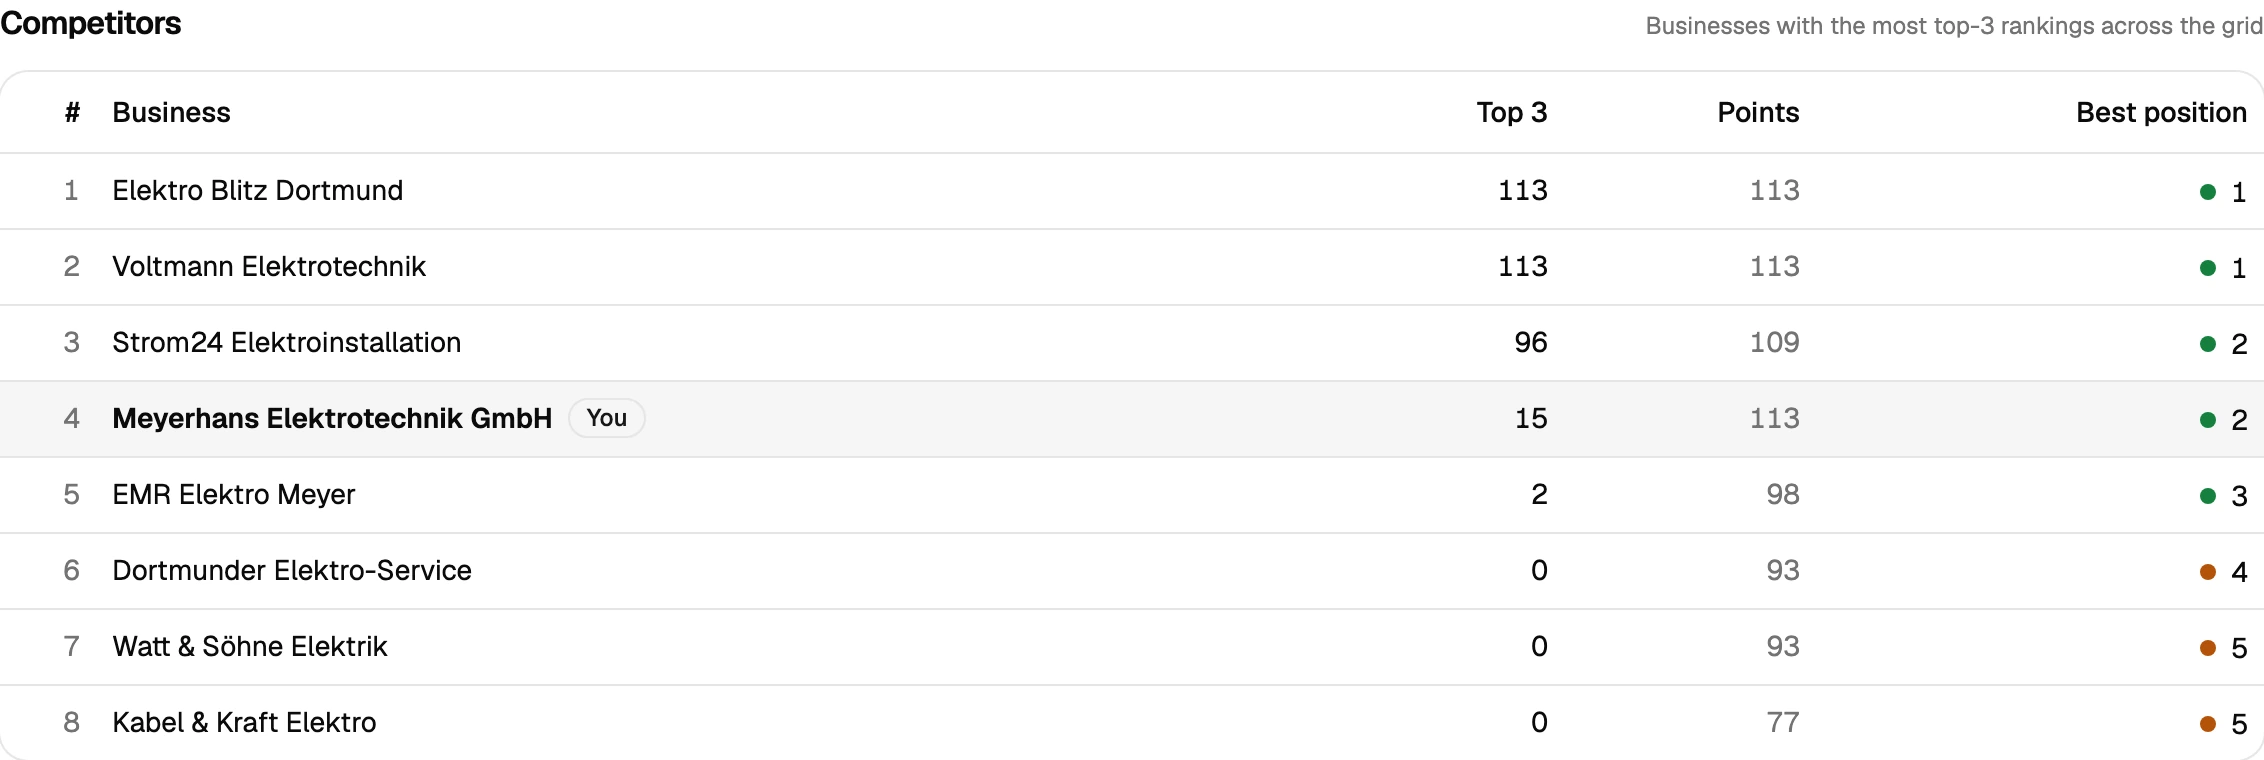
Competitor analysis shows who owns a submarket before you expand into it
Ranking every business by number of top-3 placements across the grid shows whether a given submarket is held by a national franchise brand or a scrappy local independent — a very different competitive picture, and a different pitch, depending on which one it is.
- 05
Proof that opening in a new submarket actually created visibility there
After a new branch office, a local landing page or a targeted Google Business Profile push, scan comparison lays the old and new grid side by side and shows the delta per point — improved, dropped, new, lost. That's the evidence an ownership group or a franchisor's marketing review actually wants.
What a property management company’s grid actually shows
Property management search is unusual in one important way: the customer isn’t standing near your office, they’re standing near — or thinking about — the rental property they want managed. An owner typing “property management company near me” from a rental three neighbourhoods over sees a completely different map pack than the same search run once from your headquarters, because Google recalculates it per coordinate. A grid scan centred on where your managed (and prospective) properties actually sit closes that gap directly, instead of leaving a firm to assume its head-office ranking says anything about a submarket it doesn’t actually control.
That distinction matters again once tenant-facing traffic gets mixed into the picture. “Apartments for rent” searches are a different intent from “property management company near me” — the first is a renter, the second is the owner who’s actually your customer — and scanning them together hides which submarkets are genuinely thin on owner-facing visibility. ATRP (Average Total Rank Position) counts the grid points where a firm didn’t show up at all, not just the ones where it did, which is exactly the number that reveals a submarket a firm assumed it covered but doesn’t.
For firms running several branch offices, or competing against a national franchise network with near-identical listing names in every neighbourhood, matching every project by CID/Place-ID keeps the picture honest — and competitor analysis shows plainly whether a given territory is held by that franchise network or by a scrappy local independent, which changes both the pitch and the budget needed to compete there.
Prepare your measurement
Questions we actually get asked.
Do we scan around our office, or around the properties we manage?
Around the properties. The owner deciding who manages their rental searches from that property's neighbourhood, not from your headquarters, so the grid should be centred where the properties actually are, not where you sit.
Are owner-facing and tenant-facing searches different in the map pack?
Yes — "property management company near me" (an owner looking to hire you) and tenant-facing terms like "apartments for rent" can surface very different results at the same coordinate. Scanning the owner-facing terms keeps the signal relevant to your actual customer.
We run several branch offices across the metro — will their profiles get mixed up?
No. Every project is matched by Google CID/Place-ID rather than name, so each branch office, and any competing franchise location with a near-identical name, stays cleanly separate.
How do we tell whether a franchise brand or a local competitor dominates a given submarket?
Competitor analysis ranks every business by number of top-3 placements across the grid, which shows plainly whether it's a national franchise network or an independent local firm holding that territory — useful before deciding where to expand coverage.
Is there a way to try this before committing budget to a new submarket?
Yes — 500 free credits on signup, no credit card. Enough to run a real scan across a submarket you're considering before you commit to opening a new branch there.
Can I pull the data into another tool, or do I need to read every scan myself?
Both are covered. A read-only REST API ships with every plan — self-managed, revocable keys, endpoints for projects, scans and individual grid points — so you can wire results into Zapier, n8n or your own reporting. Every completed scan also gets a short AI-generated analysis paragraph automatically, on top of the existing rule-based breakdown, so you're not staring at a raw grid trying to figure out what changed.
Lay the map over your service area.
The first scan takes under three minutes. After that you’ll see your visibility the way your customers do.